Ads DSP Dashboard Documentation
Complete guide to DataHawk's Ads DSP Power BI Dashboard; visibility into programmatic Amazon DSP campaigns from advertiser level down to individual creatives.
The Ads DSP Dashboard gives Amazon DSP advertisers detailed visibility into their programmatic campaigns. It covers investment efficiency, audience engagement, and conversion performance, from advertiser and order level all the way down to individual creatives.
Questions this dashboard helps answer
- How much am I spending on DSP, and what revenue is it generating?
- What is my Return on Ad Spend (RoAS) for my DSP campaigns?
- How often are my ads being seen (impressions), and how many people click through?
- How many shoppers visit my product detail pages after seeing a DSP ad?
- What share of my DSP-attributed sales are coming from new-to-brand customers?
- Which orders and line items are performing best by spend and conversions?
- How is my budget distributed across different line item types?
Before you start
What you need:
- Amazon DSP account connected in DataHawk
Set up: Download and configure the Power BI template. See Connect to Power BI.
Data history: The last 60 days of load when you connect. Over time, the dashboard can show up to 1 year of data once you've been connected for at least 9 months.
Dashboard tabs at a glance
| Tab | What it shows |
|---|---|
| Ads DSP Reporting | Full DSP performance: KPIs, charts, budget distribution, and explorer |
| Metrics Definition | In-dashboard glossary of all DSP metrics |
Time periods and comparisons
Date filters let you select the date range and time granularity (Year / Quarter / Month / Week / Day) for the dashboard. The bar and line chart adapts its time bucket to the granularity you choose.
Dashboard filters
General filters:
| Filter | What it does |
|---|---|
| Advertiser | Filter to a specific advertiser account |
| Country | Filter by country |
| Currency | Choose the display currency |
Entity-specific filters:
| Level | Filters available |
|---|---|
| Order | Order Name |
| Line Item | Line Item Name, Line Item Type |
| Creative | Creative Type, Creative Name, Creative Size |
Custom filters: Category, Targeting Type, Audience, and other dimensions derived from your Order or Line Item names. Requires configuration in the Data Model (see below).
Dashboard reports tab by tab
Setting up custom filters
Custom filters work by extracting keywords from your Order or Line Item names. To configure them:
Open Parameters
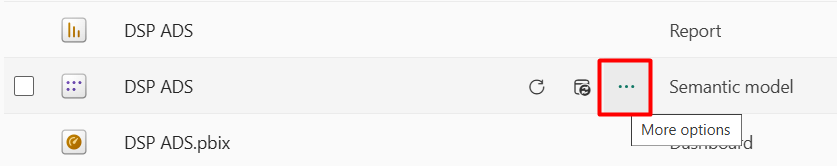
In Power BI, click the three dots next to the Data Model and go to Settings > Parameters.
Enter the terms used in your naming
For each parameter (Category, Targeting Type, Audience, etc.), enter the terms that appear in your Order or Line Item names, separated by commas. Leave a parameter blank if you don't use it.
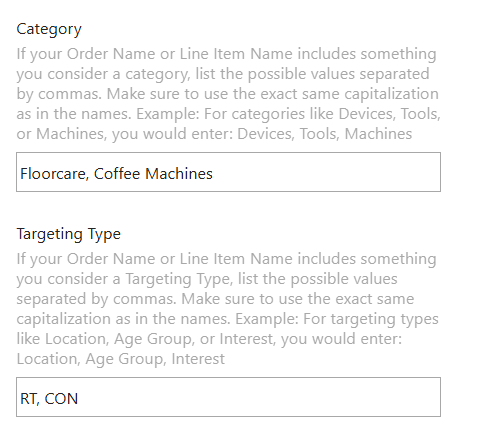
- Categories: If the names of your Orders or Line Items contain specific terms that should act as categories, add those terms to the Category Parameter (separate multiple terms with commas).
- Example: If the term "Toys" appears in your Order name and you want it to be a category, add
Toysto the Category Parameter.
- Example: If the term "Toys" appears in your Order name and you want it to be a category, add
- Targeting Types: If terms in the names indicate a targeting type, add them to the Targeting Parameter accordingly.
Parameters are case-sensitive and must match exactly. Toys and TOYS are different values.
Metrics
Formulas used in this dashboard. Concept-level definitions for acronyms live in the Glossary.
| Metric | Formula / definition | Notes |
|---|---|---|
| CTR | Clicks ÷ Impressions × 100 | |
| RoAS | Total Sales ÷ Total Cost | DSP uses Total Cost, not Ad Spend |
| eCPM | Total Cost ÷ Impressions × 1,000 | Effective cost per thousand impressions |
| eCP DPV | Total Cost ÷ DPV | Effective cost per detail page view |
| DPV | Detail page views within 14 days of an ad click or view | |
| DPVR | DPV ÷ Impressions × 100 | |
| Purchase Rate | Purchases Count ÷ Impressions × 100 | |
| Total Cost | Sum of investment across DSP campaigns | Used in place of Ad Spend |
| Sales | Sales of promoted products within 14 days of an ad click or view | |
| Total Sales | Revenue generated as a direct result of DSP campaigns | Across all brand products |
| New to Brand Product Sales | Sales of promoted products to new-to-brand shoppers | Attributed to ad view or click |
| Total New to Brand Sales | Sales of all the brand's products to new-to-brand shoppers | Attributed to ad view or click |
| Gross Clicks | All clicks including potentially fraudulent or invalid ones |
For analysts: data sources & methodology
Source tables and datasets
Data comes from Amazon's Ads API via DataHawk's processing pipeline.
For a full column reference, see the Exhaustive Column Referential.
Dashboard-specific fields
- Order Budget: Total budget allocated to a DSP order (latest value).
- Line Item Budget: Total budget allocated to a line item (latest value).
- Sales: Sales of promoted products within 14 days of an ad click or view.
- Total Sales: Revenue across all brand products generated as a direct result of DSP campaigns.
- Units Sold: Ad-attributed units sold within 14 days of a click or view (promoted products only).
- Total Units Sold: Units purchased across all brand products, attributed to the campaign.
- New to Brand Product Sales: Sales to first-time brand shoppers from promoted products.
- Total New to Brand Sales: Sales to first-time brand shoppers across all brand products.
- Purchases Count: Attributed conversion events within 14 days of a click or view.
DSP entities
These are the dashboard-context entities specific to DSP campaign structure.
- Order: High-level budget grouping within a DSP campaign.
- Line Item: Defines targeting, bidding, and delivery settings within an order.
- Creative: The individual ad asset used in a campaign.
- Creative Type: Format of the creative (display, video, etc.).
- Creative Size: Dimensions of the creative asset (e.g. 300×250).
Attribution and methodology
DSP attribution uses a 14-day post-click and post-view window. Sales, units, and purchase events that occur within 14 days of an ad interaction (click or view) are credited to the corresponding campaign. RoAS in DSP uses Total Cost rather than Ad Spend because programmatic billing includes media cost plus serving fees.
Download this template
Advertising Dashboard User Guide
Complete guide to DataHawk's Advertising Power BI Dashboard, covering all campaign types from account level down to keyword and creative.
Product Dashboard User Guide
Guide to the Product Power BI dashboard; monitor rankings, pricing, ratings, listing quality, and estimated sales for your tracked products.