Advertising Dashboard User Guide
Complete guide to DataHawk's Advertising Power BI Dashboard, covering all campaign types from account level down to keyword and creative.
The Advertising Dashboard is DataHawk's central reporting tool for Amazon and Walmart advertisers. It consolidates performance data across all campaign types, Sponsored Products, Sponsored Brands, Sponsored Display, Sponsored Videos, and DSP, at every level from account down to keyword and creative.
Questions this dashboard helps answer
- How much am I spending on advertising and what revenue is it generating (ACoS / RoAS)?
- Which campaigns are performing best, and which need optimization?
- How are my keywords performing: Am I getting clicks and conversions from the right terms?
- Which products are driving the most ad-attributed revenue (Sponsored Products + Display)?
- How has my advertising performance changed week over week or month over month?
- How is my Brand Store performing in terms of traffic and engagement?
- How do my DSP campaigns compare in terms of spend, sales, and new-to-brand impact?
Before you start
What you need:
- Amazon and/or Walmart Advertising accounts connected in DataHawk
Set up: Download and configure the Power BI template. See Connect to Power BI.
Data history:
Dashboard tabs at a glance
| Tab | What it shows |
|---|---|
| Account Overview | Aggregated totals for all ad metrics across all accounts |
| Account History | Ad performance trends over time at the account level |
| Campaign Overview | Ad metrics and KPIs per campaign, with previous period comparison |
| Campaign History | Campaign performance trends over time |
| Product Overview | Product-level ad metrics (SP + SD only) with previous period comparison |
| Product History | Product ad performance trends over time |
| Keyword Overview | Keyword and search term performance with match type breakdown |
| Keyword History | Keyword performance trends over time |
| Brand Store Overview | Brand Store ad performance aggregated totals |
| Brand Store History | Brand Store performance trends over time |
| DSP Overview | Amazon DSP performance: spend, sales, impressions, new-to-brand, and more |
Time periods and comparisons
All tabs include a date range selector at the top. Two tab patterns determine how time is handled:
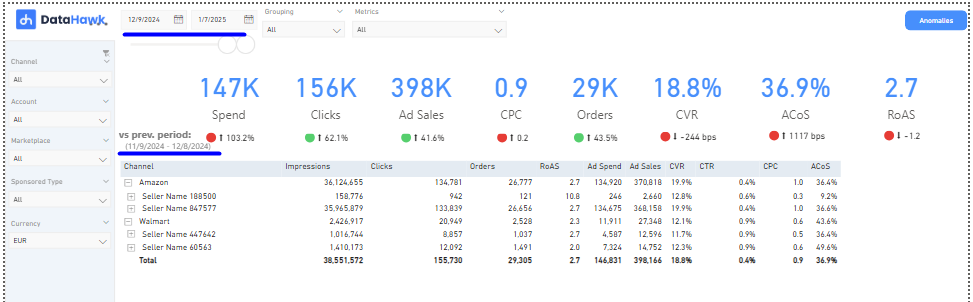
- Overview tabs compare the selected period against the prior period: The same number of days, immediately before the selected range. KPI cards show the selected-period totals alongside the prior-period comparison.
- History tabs include a Timeline By selector (Year / Quarter / Month / Week / Day) that controls both the chart and the table below it. Two axis slicers let you compare multiple metrics on the left axis against a single metric on the right. For example, Impressions and Clicks (left) vs. Conversion Rate (right).
Dashboard filters
Tabs share a common filter panel in the left rail. The same data can be sliced by:
| Filter | What it does |
|---|---|
| Channel | Filter to Amazon or Walmart |
| Account | Filter to one or more ad accounts |
| Marketplace | Filter to specific marketplaces |
| Sponsored Type | Filter to SB, SD and/or SP |
| Currency | Choose the display currency for monetary metrics |
Analyzing the reports
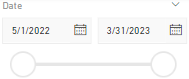
All tabs of this report include a date range selector.
At the top of each Overview tab you can see Grouping & Metrics slicers that allow you to choose what you want to see as rows and columns in the table below. Depending on what you have selected, you can further breakdown the overview metrics listed on the table.
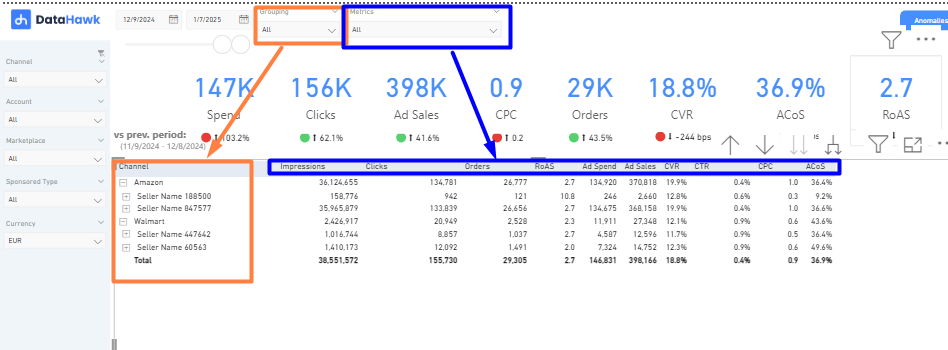
Under these slicers, there are KPIs that are displayed alongside its corresponding comparison to the previous period (the previous period is of the same length as the selected one, covering the dates immediately prior). Definitions for each metric and KPI can be found in the glossary below.
At the top of each History Tab, you will find the Timeline By option, which allows you to adjust the time granularity reflected in the graph and table below. You can select between Year, Quarter, Month, Week, or Day views, depending on your analysis needs.
Below the Timeline By section, two slicers let you customize the graph. You can select multiple metrics to display on the left axis and compare them to a single metric on the right axis. The slicers are color-coded to match their respective axes, making it easy to understand which metrics correspond to which axis.
Use Case: For example, you might compare Impressions and Clicks (on the left axis) with Conversion Rate (CVR) (on the right axis). This setup allows you to analyze how increase in visibility (impressions) and engagement (clicks) correlate with actual sales performance (conversion rate).
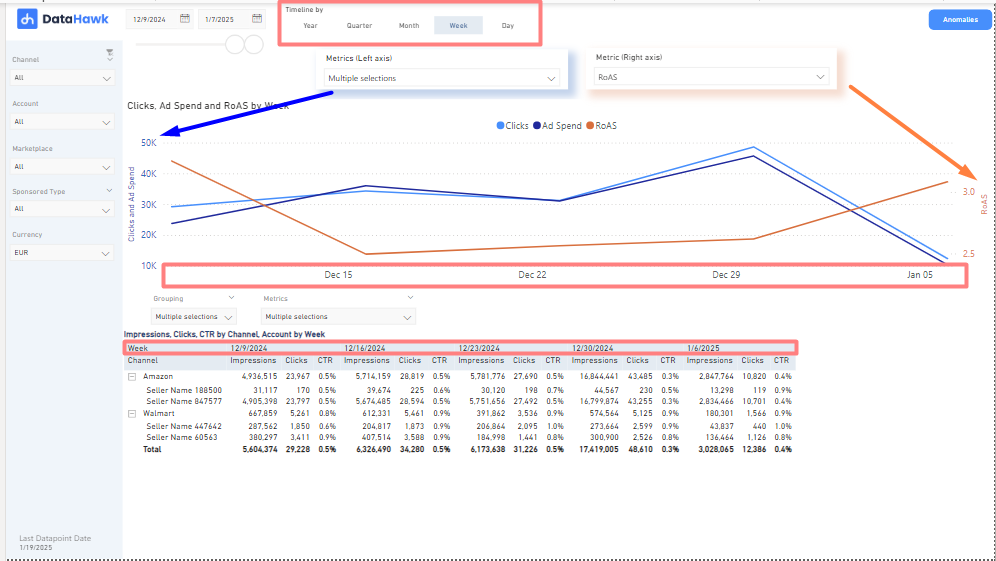
In the tables available across all History Tabs, you can customize the grouping and metrics displayed according to your preferences. Note that the history tables always use the selected "Timeline By" granularity as their columns.
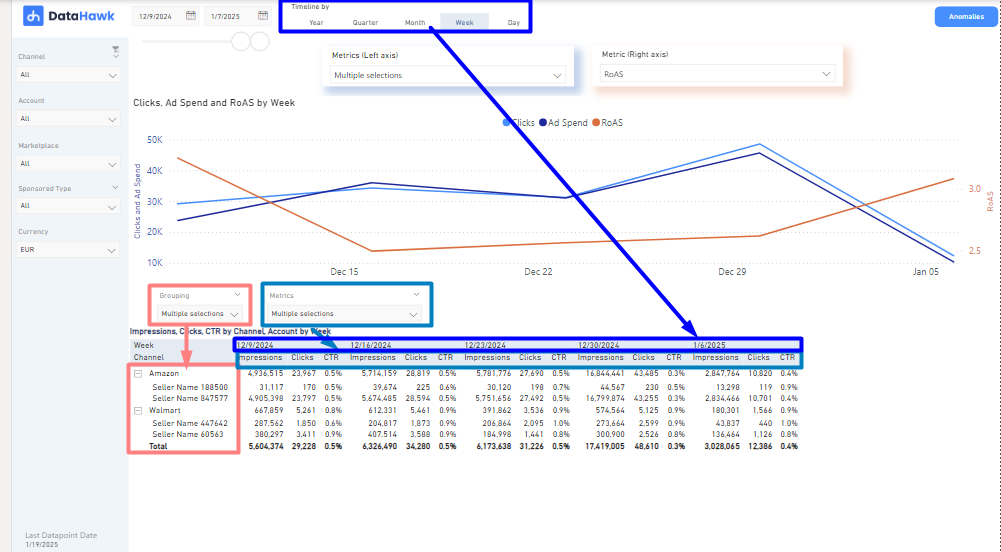
If you select multiple metrics, they will be displayed for each time period based on the chosen granularity.
Dashboard reports tab by tab
Custom filters (Campaign and DSP tabs)
Custom filters extract dimensions from Campaign, Ad Group, Order, or Line Item names. To configure them:
Open Parameters
In Power BI, go to Data Model settings → Parameters.
Enter the terms used in your naming
Type the terms you use in naming your campaigns or orders, separated by commas.
Assign them to the relevant parameter
Map your terms to the right parameter (Category, Targeting Type, Audience, etc.).
Parameters are case-sensitive. Retargeting and retargeting are treated as different values.
Metrics
Formulas used in this dashboard. Concept-level definitions for acronyms live in the Glossary.
| Metric | Formula / definition | Notes |
|---|---|---|
| ACoS | Ad Spend ÷ Ad Sales × 100 | Lower is more efficient. ACoS of 30% means you spend 30% of ad revenue on ads |
| RoAS | Ad Sales ÷ Ad Spend | Inverse of ACoS, expressed as a multiplier. RoAS of 5 means you earn 5× your ad spend in revenue |
| CTR | Clicks ÷ Impressions × 100 | Higher CTR implies ads are engaging |
| CPC | Ad Spend ÷ Clicks | Higher CPC may indicate more competitive ad space |
| CVR | Orders ÷ Clicks × 100 | Attribution per Amazon's 14-day post-click window |
| New to Brand Sales | Revenue from first-time brand shoppers | Available for Sponsored Brands, Sponsored Display, and DSP |
| New to Brand Orders | Orders from first-time brand shoppers | Available for Sponsored Brands and Sponsored Display |
| New to Brand DPV | Detail page views from new-to-brand shoppers | Sponsored Display only |
| New to Brand DPV Clicks | Ad clicks that resulted in a new-to-brand detail page view | Sponsored Display only |
DSP-specific metrics
| Metric | Formula / definition | Notes |
|---|---|---|
| Total Cost | Total investment in DSP campaigns | |
| DPV | Product detail page views within 14 days of an ad click or view | |
| DPVR | DPV ÷ Impressions | |
| eCPM | Total Cost ÷ Impressions × 1,000 | Effective cost per thousand impressions |
| eCP DPV | Total Cost ÷ DPV | Effective cost per detail page view |
| RoAS (DSP) | Total Sales ÷ Total Cost | DSP uses Total Cost instead of Ad Spend |
| Purchase Rate | Purchases ÷ Impressions | |
| Gross Clicks | All clicks including potentially invalid ones |
For analysts: data sources & methodology
Source tables and datasets
Data is sourced from Amazon's Ads API and Walmart Connect. For a full column reference, see the Exhaustive Column Referential. For Amazon dataset details, see Amazon Advertising Data.
For a full column reference, see the Exhaustive Column Referential.
Ad entities
These are the dashboard-context entities used to group and filter ad performance. They are not glossary terms.
- Ad Account: Seller name (Amazon) or account key (Walmart).
- Campaign: A set of ad groups and keywords targeting a specific audience or goal.
- Portfolio (Amazon only): Grouping of campaigns for shared budget management.
- Ad Group: Subset of a campaign organizing ads and targeting settings.
- Search Term: The exact phrase a user typed into the search bar.
- Keyword: The targeting criterion set by the advertiser (not always the same as the search term).
- Brand Entity ID / Brand Name: Brand-level identifier for Brand Store campaigns.
- Order (DSP): High-level budget grouping within a DSP campaign.
- Line Item (DSP): Specific targeting and delivery settings within an order.
- Creative (DSP): Individual ad asset including type (display/video) and size.
Attribution and methodology
Ad performance metrics use Amazon's 14-day post-click attribution window for sales, orders, and conversions. DSP RoAS uses Total Cost (not Ad Spend) and includes both view-through and click-through attribution within the same 14-day window.
Changelog (January 2026):
- Added Brand Store Overview and Brand Store History tabs
- Introduced dedicated DSP Overview tab with DSP-specific metrics, advanced filters, and Explorer tools
- Added Custom Filters to Campaign Overview and Campaign History
- Expanded New-to-Brand metrics for Sponsored Brands and Sponsored Display
- Added New-to-Brand DPV metrics for Sponsored Display campaigns
Download this template
Market Intelligence Dashboard User Guide
Complete guide to DataHawk's Market Intelligence Power BI Dashboard; category-level analysis of pricing, ratings, market share, and brand presence.
Ads DSP Dashboard Documentation
Complete guide to DataHawk's Ads DSP Power BI Dashboard; visibility into programmatic Amazon DSP campaigns from advertiser level down to individual creatives.