Analytics Essentials User Guide
A ready-to-use Looker Studio template covering products, keywords, ads, sales, finance, traffic, and inventory; one dashboard for your Amazon business.
DataHawk's Analytics Essentials is a ready-to-use Looker Studio template built on best practices from brands and agencies. It connects directly to your BigQuery database and gives you a single, unified dashboard covering your full Amazon business, products, keywords, advertising, sales, finance, traffic, and inventory, without any setup beyond connecting your data sources.
Questions this template helps answer
- How are my tracked products performing in terms of BSR, pricing, Buy Box, and listing quality?
- Which keywords am I ranking for organically, and where are competitors showing up in sponsored results?
- How is my advertising spend and return performing across campaigns and products?
- What are my actual sales, returns, and revenue broken down by product and geography?
- What is my P&L: Including Amazon fees, COGS, and net profit?
- How are my page views, sessions, and Buy Box win rate evolving over time?
- What is my current FBA inventory status and how has it changed historically?
Prerequisites
Before requesting access, make sure you have:
- An active BigQuery database: DataHawk must be connected to a BigQuery instance. If not yet, see Send data to your tool.
- Sources configured: Your Amazon Seller, Vendor, or Advertising accounts are added as sources in DataHawk. If not, see Set up data.
- A Google account registered on the BigQuery access list: Go to Setup → Destinations → BigQuery → Access in the DataHawk app and add your Google email. Access to the template is shared via Google invitation to that exact address, so registering it before requesting is mandatory or the invitation won't reach you.
How to get access
Self-serve access is coming. In the near future you will be able to access the template directly from the DataHawk app. Until then, access is granted by the DataHawk team via the steps below.
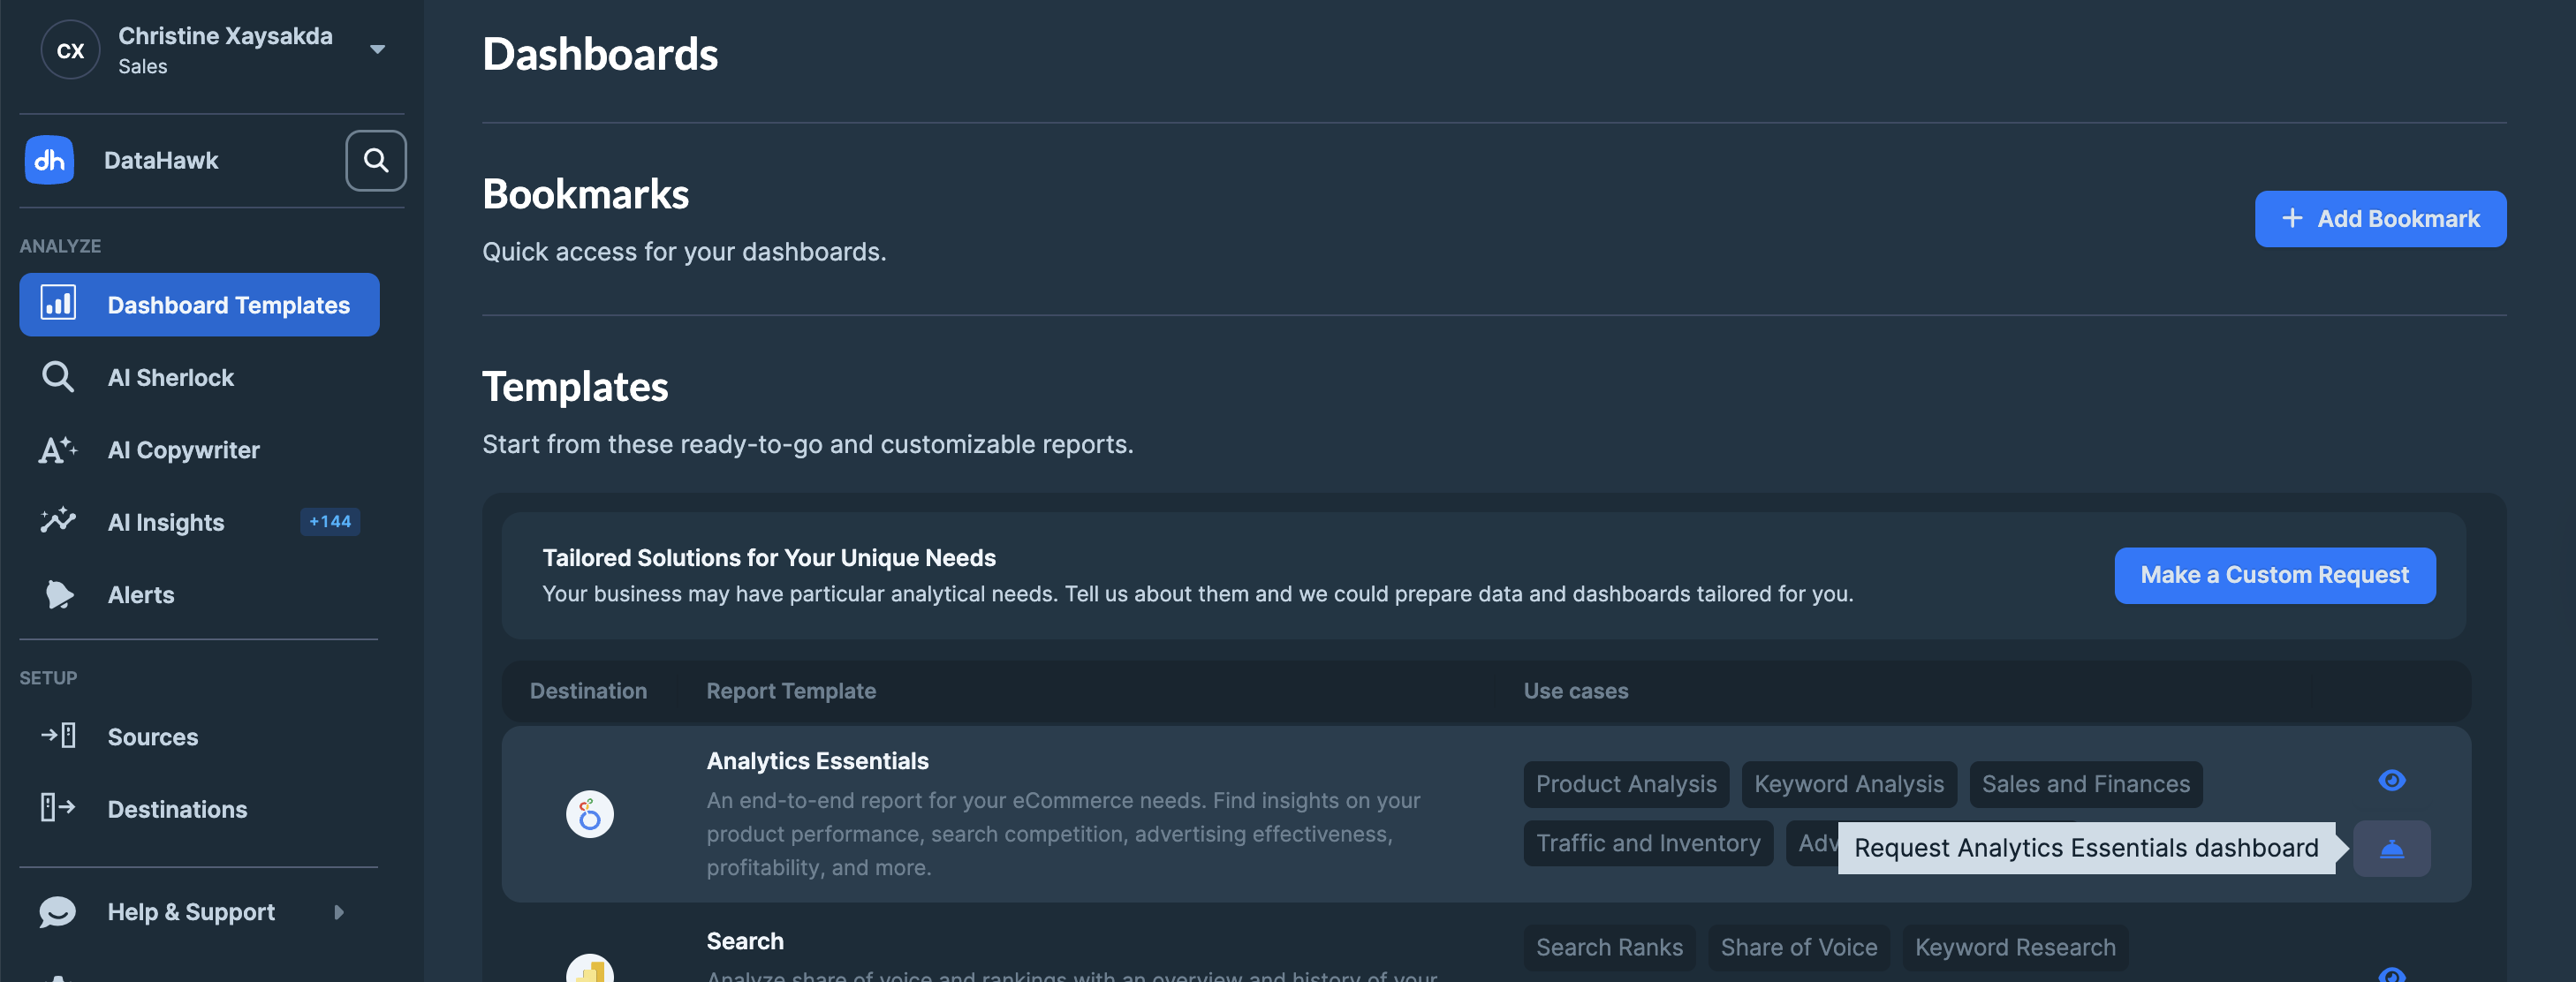
Open the Report Templates page
Go to the Report Templates page in the DataHawk app.
Request access to Analytics Essentials
Find the Analytics Essentials template and click Request Access.
Send the prepared message
A draft message is prepared for you. Click Send to submit your request to the DataHawk team.
Wait for the DataHawk team to share the template
A team member will reach out and share the dashboard with the Google email you registered in your BigQuery access list.
Accept the Google invitation
You'll receive a Google email invitation to access the template. Open it and accept to land in your personal copy of the dashboard.
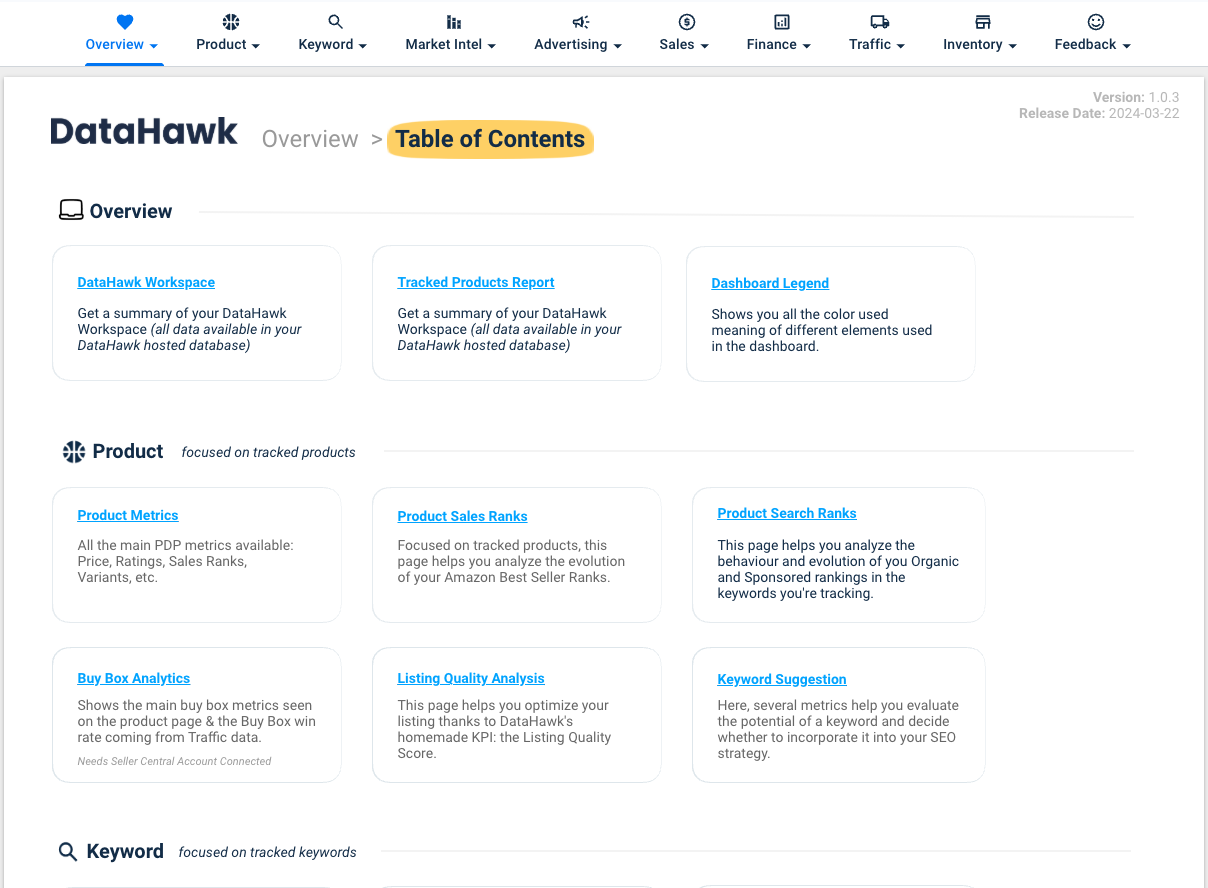
What's inside Analytics Essentials
The template is organized into 9 sections, each containing multiple report pages. All sections share a consistent theme and are designed to work together as a single source of truth for your Amazon business.
1. Overview
An orientation section that sets the context for the rest of the template.
2. Product
Product-level intelligence across rankings, pricing, Buy Box, listing quality, and keyword suggestions.
| Page | What it shows |
|---|---|
| Metrics | Key metrics for your tracked products: price, ratings, review count, estimated sales, BSR |
| Product Metrics by Brand | Best Seller rankings by ASIN |
| Sales Ranks | Best Sellers Rank (BSR) trends over time, by product and category |
| Search Ranks | Organic search ranking positions for your tracked keywords, by product |
| Buy Box | Buy Box ownership rate and competitor Buy Box activity |
| Listing Quality Analysis | Listing Quality Score (LQS) breakdown and recommendations |
| Keyword Suggestion | Keyword ideas to improve organic visibility based on your product catalog |
3. Keyword
Keyword ranking and visibility across both organic and sponsored placements.
| Page | What it shows |
|---|---|
| Keywords Metrics | Overview of tracked keywords with ranking positions, search volume, and trend indicators |
| Organic Products | Which of your products rank organically for each tracked keyword, and at what position |
| Sponsored Products | Which products appear in sponsored results for each tracked keyword, and their ad rank |
| Search Ranks | Organic search ranking positions for your tracked keywords, by keyword |
| Search Ranks Monitoring | Organic or Sponsored search ranking positions for your tracked keywords, tags, or product |
4. Market intelligence
| Page | What it shows |
|---|---|
| Overview & market share | Overview market share and by segments |
| Exports | Export brand and product revenue and revenue share |
4. Advertising
Advertising performance across campaigns and products for Amazon Ads.
| Page | What it shows |
|---|---|
| Overview | Account-level totals: ad spend, ad sales, impressions, clicks, ACoS, RoAS |
| Campaign | Campaign-level breakdown with spend, performance, and efficiency metrics |
| Product | Product-level ad performance for Sponsored Products and Sponsored Display |
5. Sales
Sales performance, geographic breakdown, purchasing behavior, and FBA returns.
| Page | What it shows |
|---|---|
| Sales Performance | Revenue, units sold, and order trends over time |
| Sales Location | Sales breakdown by marketplace and geography |
| Purchase Analysis | Order patterns, repeat purchase behavior, and basket analysis |
| FBA Returns Analytics | Return rates, return reasons, and the financial impact of FBA returns |
| Walmart Sales Performance | Walmart specific revenue, units sold, and order trends over time |
6. Finance
Profit and loss reporting at summary, detailed, and historical levels.
| Page | What it shows |
|---|---|
| Executive | High-level P&L: revenue, Amazon fees, COGS, advertising costs, and net profit |
| Explorer | Line-by-line breakdown of all revenue and cost components |
| Products | Monthly P&L trend showing how profitability has evolved over time |
The Finance section requires your Cost of Goods Sold (COGS) to be uploaded to DataHawk. Without COGS data, gross profit, operating profit, and net profit figures will not be accurate. See Upload Amazon Product Expenses (COGS) for the step-by-step upload guide.
7. Traffic
Customer traffic analysis covering page views, sessions, and Buy Box win rates.
| Page | What it shows |
|---|---|
| Sessions & Page Views | Trends in product page views and unique sessions over time |
| Buy Box | Buy Box win rate history and product-level Buy Box performance |
8. Inventory
FBA inventory status at the latest snapshot and over time.
| Page | What it shows |
|---|---|
| Metrics: Latest | Current inventory snapshot: Available units, inbound, reserved, and unfulfillable stock |
| Metrics: Historical | How inventory levels have changed over time for each tracked ASIN |
9. Feedback
Use the Feedback Form to report issues, request new report pages, or suggest improvements. The DataHawk team monitors submissions actively.
Template details
| Template name | Analytics Essentials |
| Version | 1.1 |
| Data source | Google BigQuery (DataHawk-hosted or customer-hosted) |
| Compatible tools | Looker Studio (Google Data Studio) |
Metrics
Formulas used in this template. Concept-level definitions for acronyms live in the Glossary.
Advertising
| Metric | Formula / definition | Notes |
|---|---|---|
| ACoS | Ad Spend ÷ Ad Sales × 100 | Lower is more efficient |
| RoAS | Ad Sales ÷ Ad Spend | Inverse of ACoS, expressed as a multiplier |
| TACoS | Ad Spend ÷ Total Sales × 100 | Advertising cost relative to total sales, not just ad-attributed sales |
| CTR | Clicks ÷ Impressions × 100 | |
| CPC | Ad Spend ÷ Clicks | |
| CVR | Orders from Ads ÷ Clicks × 100 |
Traffic and sales
| Metric | Formula / definition | Notes |
|---|---|---|
| Sessions CVR | Orders ÷ Sessions × 100 | Session-to-purchase conversion |
| Buy Box Win % | Page views with your offer as Featured Offer ÷ Total page views × 100 | Active listings only |
| ASP | Sales ÷ Units Sold | Average Selling Price |
| Return Rate | Returns ÷ Net Revenue × 100 | FBA returns relative to revenue |
Profit and loss
| Metric | Formula / definition | Notes |
|---|---|---|
| Net Revenue | Gross Revenue − Refunds | |
| Gross Profit | Net Revenue − COGS | |
| Operating Profit | Gross Profit − Amazon Fees − Marketing | |
| Net Profit | Adjusted Operating Profit − Net Taxes |
For analysts: data sources & methodology
Data source: The Analytics Essentials template connects to your BigQuery database. All DataHawk data models available in BigQuery are accessible from within the template. For a full reference of available tables and columns, see the Exhaustive Column Referential.
Customizing the template, When DataHawk shares the Analytics Essentials template with you, you receive your own personal copy. This means you can freely customize it, add new charts, adjust filters, rename pages, or connect additional BigQuery data; without affecting other users or the master template.
Template updates, When DataHawk publishes a new version of the Analytics Essentials template, updates propagate automatically to your copy. You do not need to re-request access or take any action, improvements and new report pages will appear in your dashboard directly.
Looker Studio Templates
DataHawk's Looker Studio template; analytics Essentials covers products, keywords, ads, sales, finance, traffic, and inventory in one dashboard.
White-label your Dashboards for customers
Three approaches to delivering client-specific Looker Studio dashboards with DataHawk data isolation, from manual duplication to portal-based delivery.