Insights are proactive notifications that are based on automated data exploration. They are designed to notify you of significant findings or anomalies detected within your data and provide you with best practice recommendations on optimizing your business performance. They cover all business domains, such as your ads, products, sales, SEO performance, and market. Once you have connected your advertising and sales data, you will be ready to start receiving Insights.
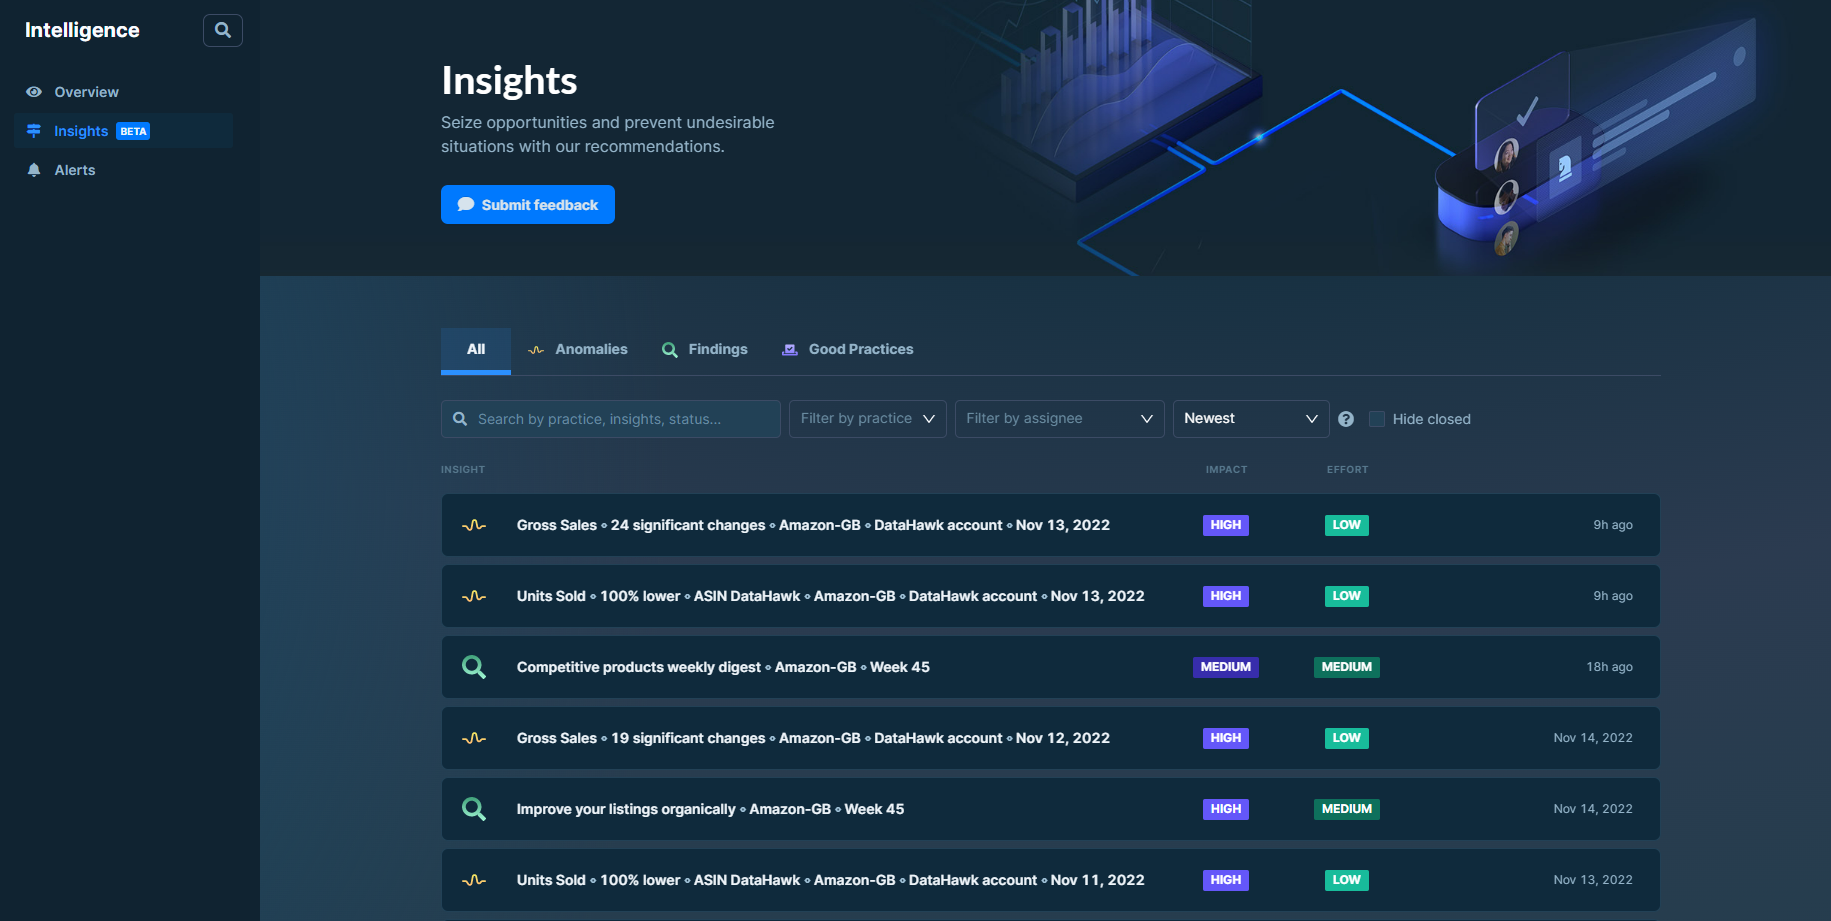
You can receive three types of Insights: Findings, Anomalies, and Good Practices.
Findings are business-savvy Insights that help you manage specific aspects of your business. They can include actionable recommendations that advise you on how to optimize the corresponding metric brought into question.
Anomalies are Insights that shed light on outliers in your data. They notify you of unexpected changes our software has detected within your data. To save you time on analysis, we monitor the evolution of various metrics to spot any irregularities.
Good Practices are a curated selection of eCommerce essentials that are ideal prerequisites to help you improve your business metrics. They are not based on your data but ensure you have basic industry knowledge that will help you get started.
📘 Tip
You can also access Insights using the shortcut on the homepage.
DataHawk aims to provide you with Insights seamlessly. However, for some Insights, we need access to specific data. The table below sums up what you should get depending on how you set up your workspace.
| Prerequisites | Review ineffective Sponsored Products Ad campaigns | Review top-performing Sponsored Products Ad campaigns | Improve your listings organically | Competitive products weekly digest | Finance anomaly | Ads Anomalies | SEO Anomalies | Market Anomalies | Product Anomalies |
|---|---|---|---|---|---|---|---|---|---|
| Products tracked and set as "Owned" | ✅ | ✅ | ✅ | ✅ | ✅ | ||||
| Ads account connected | ✅ | ✅ | ✅ | ✅ | ✅ | ||||
| Seller Central account connected | ✅ | ✅ | ✅ |
You can use the filters selector in your Insights list to select specific properties to filter your insights by.
Sources properties: